 Crowd Counter
Game attendance tracking for athletics departments
If you run game operations for a college or school athletics program, attendance isn't optional bookkeeping. Conferences ask for it, the NCAA requires it for certain sports, marketing wants it for sponsors, and your AD wants to know whether Tuesday volleyball is growing. The hard part isn't counting one game — it's producing a defensible number for every home game, across every sport, all season long.
Why the usual methods fall short
Ticket scans are the gold standard where they exist, but most non-revenue sports don't ticket at all, and free-admission games have no gate data. Scans also count entries, not the people actually in the stands at tip-off.
Eyeball estimates from the scorer's table are how most non-ticketed games get counted today. They're fast — and they're guesses. When numbers feed conference reports, a guess with no evidence behind it is a liability.
Section counts by staff are accurate but expensive: someone spends fifteen minutes counting bleachers instead of running the event, and the method quietly degrades by the tenth game of the season.
Photo-based counting: one photo per game
The approach that scales across a whole season is photo-based AI counting: at a consistent moment (say, midway through the second quarter), one staff member takes a single photo of the stands. A crowd-counting model counts every person in seconds and files it into that sport's season record.
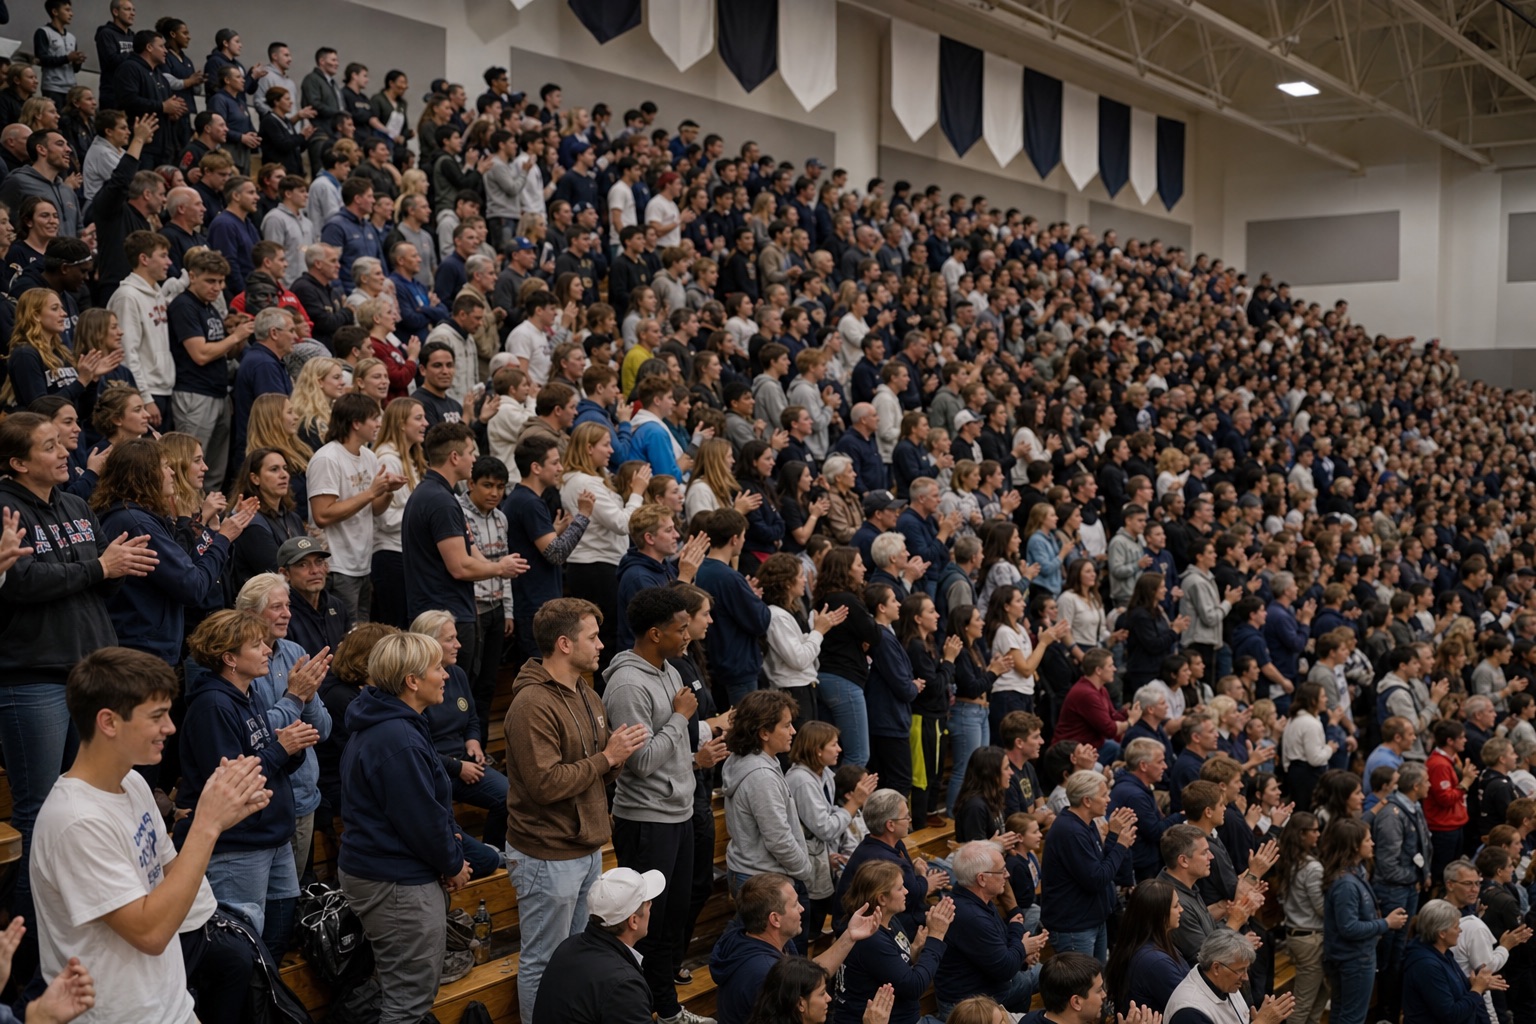
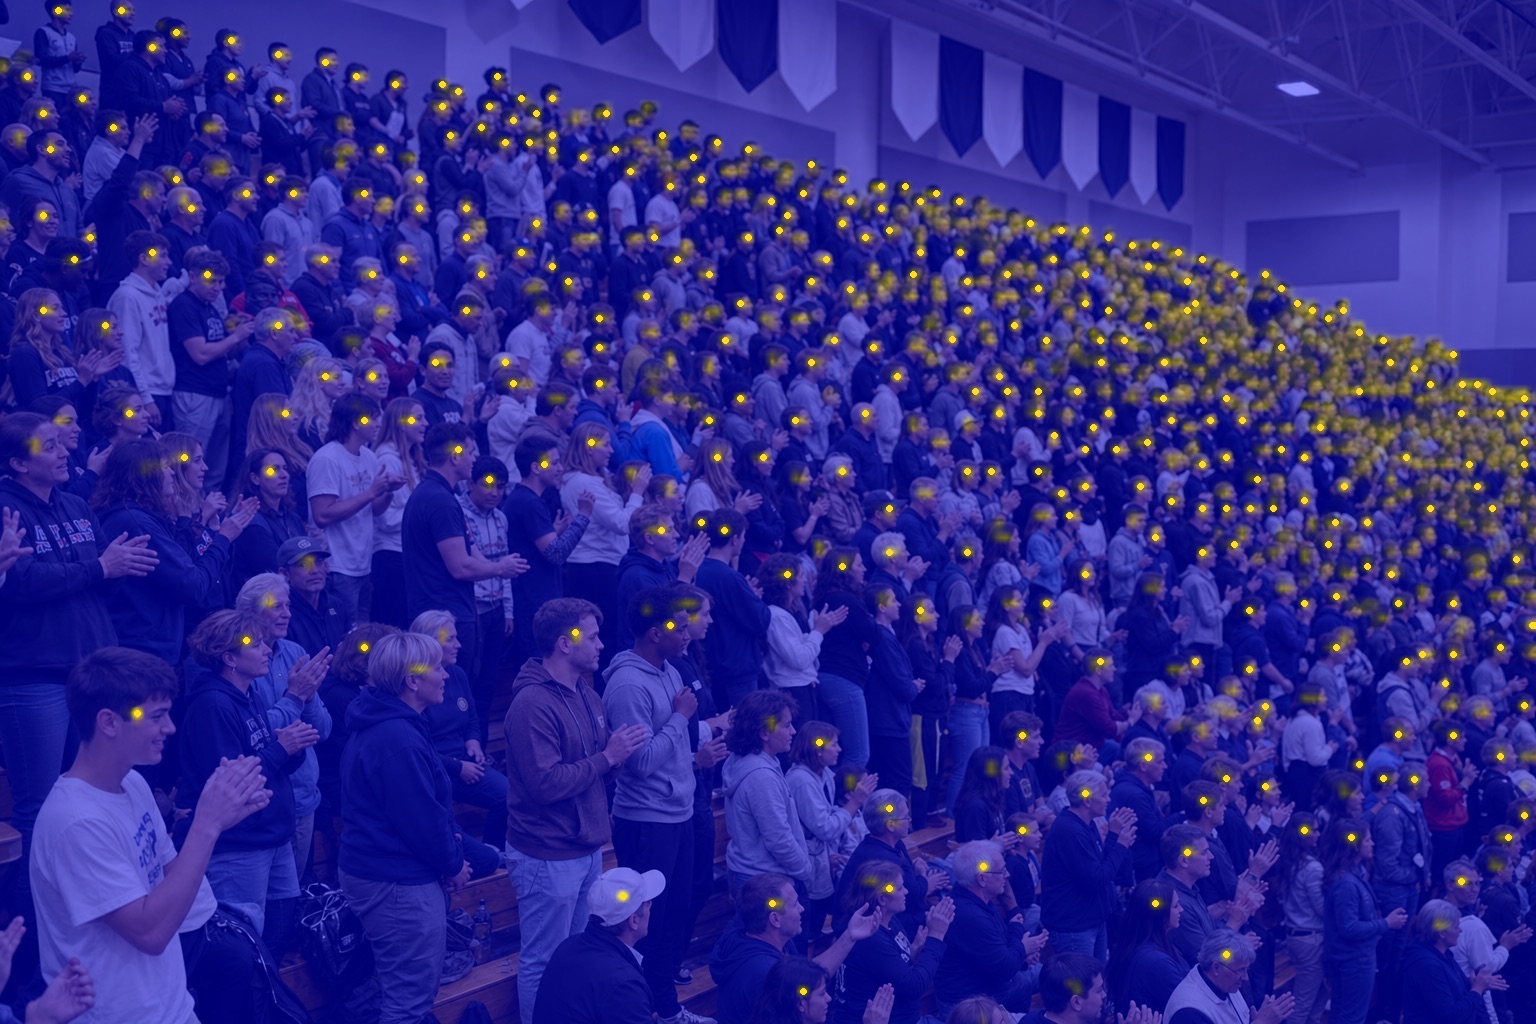
The advantages compound over a season:
- It's one person's ten-second job, so it actually happens at every game — baseball on Friday, volleyball on Tuesday, basketball on Saturday.
- The photo is the receipt. Every number in your report has the image behind it. Nobody has to defend a guess.
- Trends become real. Same method, every game, means promotions nights and schedule changes show up in the data instead of the noise.
This is exactly the workflow Crowd Counter was built around: photo → count in seconds → filed to the season → exportable PDF and CSV reports with the photo attached to every count. One athletics department used it for 50 counts across an 18-game-day season spanning basketball, baseball, and volleyball.
Count your next home game from one photo — your first count is free.
Download Crowd CounterSetting up a season workflow
- One group per sport per season — "Basketball 2026–27", "Volleyball 2026". Records stay clean and comparisons stay honest.
- Pick the count moment and write it into the game-ops checklist. Consistency is what makes the season graph mean something.
- Assign it to a role, not a person. Whoever runs the book or the clock takes the photo. Ten seconds.
- Export at reporting time. A season's attendance report — every game, every count, every photo — should be one tap, not an afternoon of spreadsheet archaeology.